March 8, 2025
A week into March, US equities sit in a precarious position. The S&P 500 (chart below, 1yr daily) is at near-term support and has formed negative momentum divergences on both of our favored oscillator studies, the MACD and the RSI (chart, panels 2 & 3). The index bounced last Friday after hitting the 5667 level intra-day which is almost exactly where equities paused in July of 2024. Investors have walked back bullish expectations around the Fed’s interest rate policy and President Trump’s deregulatory agenda as our Commander in Chief prioritizes fighting a trade war to start his administration.

The current correction has taken S&P 500 shares down 7.83% peak to trough since the latest all-time high for the index was made on February 19. The important question of course is whether this is the onset of a recession and a deeper bear market or a shake-out that we should be looking to accumulate. For the time being we would expect any near-term rally to fail at the 50-day moving average (currently 5982). We think this because we are seeing increasing downside momentum in the near-term. We have set a downside target 5263.95 as a likely accumulation point (chart above, yellow line).
The chart below is a 3-month chart of the S&P 500. The MACD and RSI studies become important when equities are in correction mode because positive momentum divergences can help us get an edge on calling bottoms just like negative momentum divergences can help us spot a weakening uptrend and a potential top. One thing that is unambiguous for now is there is no positive momentum divergence developing in the S&P 500 in the near-term. The MACD and RSI studies, panels 2 and 3 respectively, have made lower-lows in the near-term undercutting December-January lows on the study.
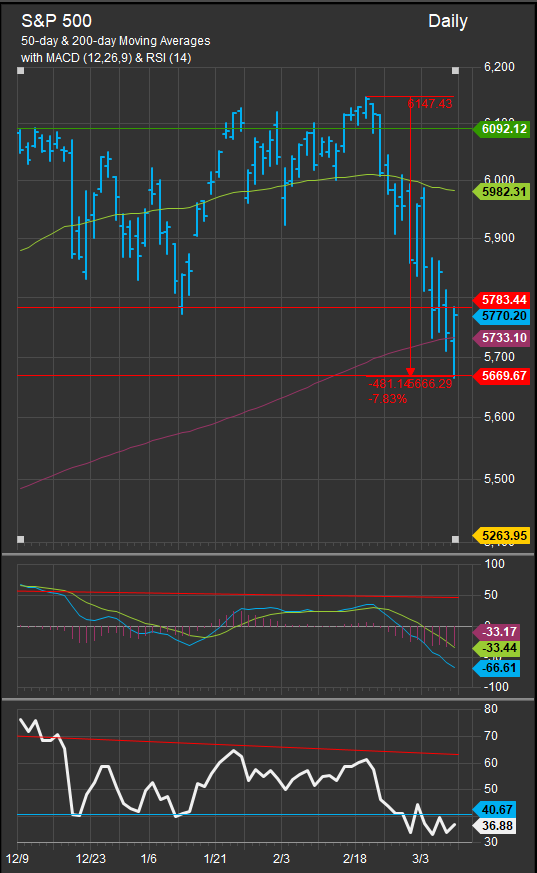
If we undercut support at 5668, but the RSI study is higher than 35, that’s the start of a positive momentum divergence and that’s when we would start to position more aggressively for a bullish reversal.
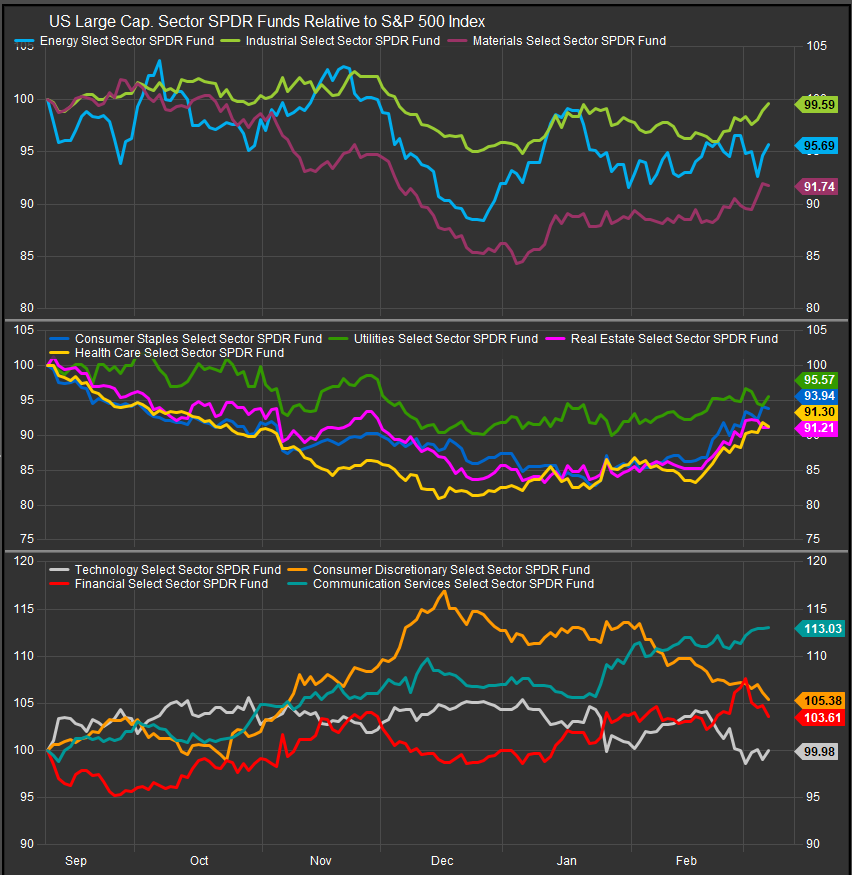
Sectors still Showing a Bearish Posture
The chart below shows sector performance vs. the S&P 500 over the past 6-months. Correction has come with a clear rotation into defensive sectors (panel 2). Commodities-linked sectors (top panel) are firming in the near-term, while cyclical sectors (bottom panel) have generally been retracing gains. Even the Comm. Services sector which owns the strongest intermediate-term outperformance trend is being powered by the like of VZ and T rather than GOOG/L and META in the near-term. Investors are taking profits and paring risk exposure after a 2 year bull run.
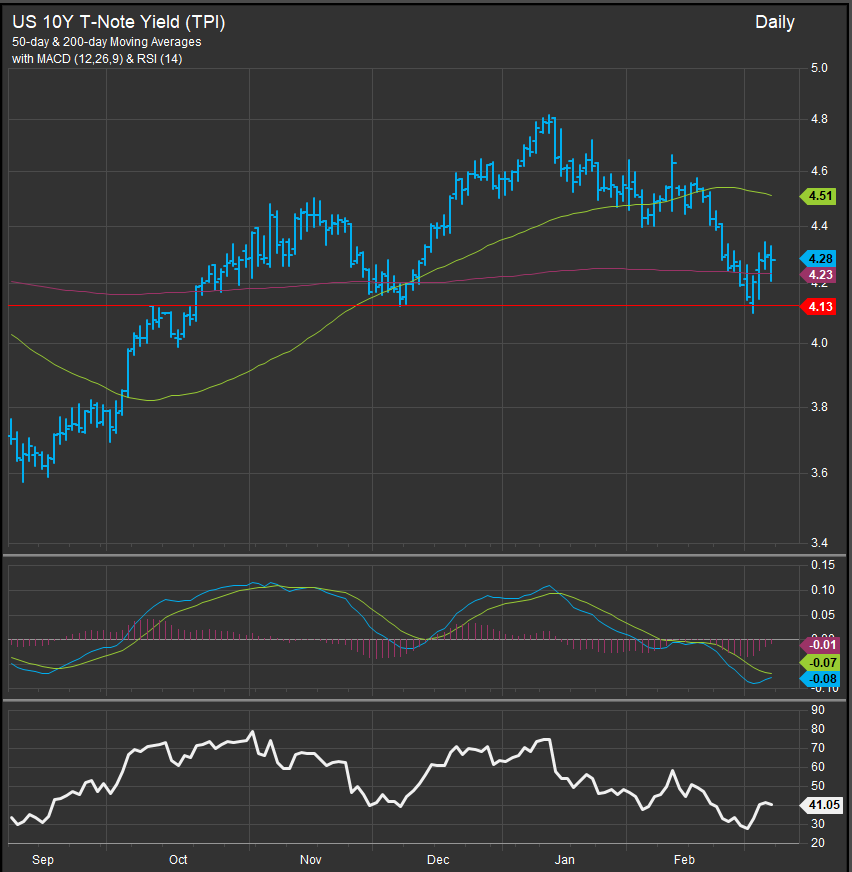
Rates at Support
The 10yr Yield is now bouncing off intermediate-term support at the 4.1-4.13% level. We think a continued move lower would signal recession positioning and would likely act as a tailwind to the dividend sector trade in the near-term. However, we do feel that lower rates can potentially act as a bullish pivot. And we would be mindful that the 3.6% level is where buyers felt comfortable buying the bull market’s leadership themes and speculating on a housing market recovery.
The Consumer is the Likely Pivot
The consumer is one of the potential pivots and, given the housing market is generally an exercise in leverage, we can’t see the economic cycle perking up until we can identify how the Consumer will stay in the game. Higher pay or lower rates are two of the only broad-based ways we’re getting there, and we are starting to see some cracks in employment with concern over tariff implications growing.
Given the technical setup of the US equity market, we expect a continued shake-out in the near-term. We want to see a positive momentum divergence on the S&P 500 oscillator studies and rates on a 3-handle before we think about trying to catch a falling knife.
Patrick Torbert, Editor & Chief Strategist, ETFSector.com
Data sourced from FactSet Research Systems Inc.