The S&P 500 ended 2024 notching a >20% gain for the second consecutive year. The last week of December saw a profit-taking motive assert itself among market participants. Short-term oversold conditions were accumulated on Friday setting up Monday trading as the first potential pivot point of the year.
Considering the bull market to this point, the chart below highlights the S&P 500’s trend channel and the biggest drawdowns during the cycle so far. July-November of 2023 and July-August of 2024 marked the most significant challenges to the bull trend to date. Both registered peak-to-trough declines of just greater than 10%. For comparisons sake, the end of the year decline in 2024 was a decline of just less than 5%.
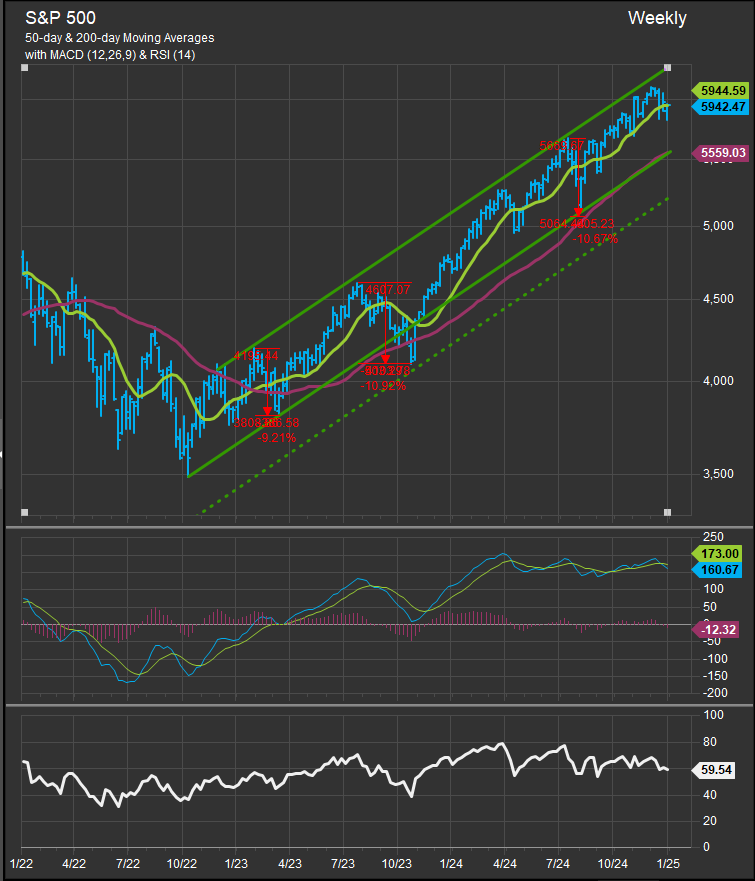
Oscillator studies (RSI and MACD) show upside momentum on a weekly basis has cooled off, with the RSI study developing a negative momentum divergence since April of 2024. Our base case for 2025 is that the 200-day moving average will likely contain corrective action in the existing uptrend for the S&P 500 and we should be poised to accumulate if equities correct to that level, roughly 5% below today’s price at 5559 on the index.
Looking at US GICS Sector performance over the past 3-months the choices facing sector allocators is very clear. Any weakness at the index level for equities is likely to spark rotation away from previous leadership in Discretionary, Financials, Comm. Services and Tech Sectors towards a mix of low vol. and commodities linked sectors. Our macro/technical process consistently ranks the Materials and Healthcare Sectors as the weakest areas of the equity market from both a bottoms up and a top-down analysis. We think the only path to bullish reversal there is a deeper equity correction against a backdrop of rising rates which we will discuss later in this note.

From a big picture perspective what we are watching for 2025 is whether the bull market can sustain without Mag7 and/or Semiconductors as leadership, whether rates will stay contained below the key 4.67% on the US 10yr bond yield, or whether rising rates will sink consumer spending and push equities into a more bearish scenario than we currently expect. Please read on for our outlook on the biggest themes in 2025 for US equities and their implications of sector investing.
Patrick Torbert, Editor & Chief Strategist, ETFSector.com
How Long Can This Bull Cycle Last?
We are students of history at ETFsector.com, and we think that becomes important when a trend becomes mature as the current bull trend is. The uptrend we highlighted at the beginning of this note has now lasted 2 years and has pushed prices +26.28% above the 2021 peak for the S&P 500. This price action has transpired within a secular bullish context. Secular trends are a fact of history and offer important information about investor behavior. Secular trends manifest as bullish or bearish price action over a set of contiguous business cycles and generally last 10-20 years in duration. Secular bear markets are similar, but historically a little shorter and generally last 10-15 years in duration.
Secular bull markets START at new long-term or all-time highs rather than at lows because their behavioral profile is defined by optimism for equities. Buying a low, for example is not an “optimistic” behavior, it is a value seeking behavior as it is akin to shopping the “on sale” section in hopes of a good deal. Buying a security or the equity market in aggregate at its all time high is enthusiastic behavior. Investors know the price is as high as its ever been, but they perceive value in future prospects anyways and they back it up with action by investing their money at the highest prices.
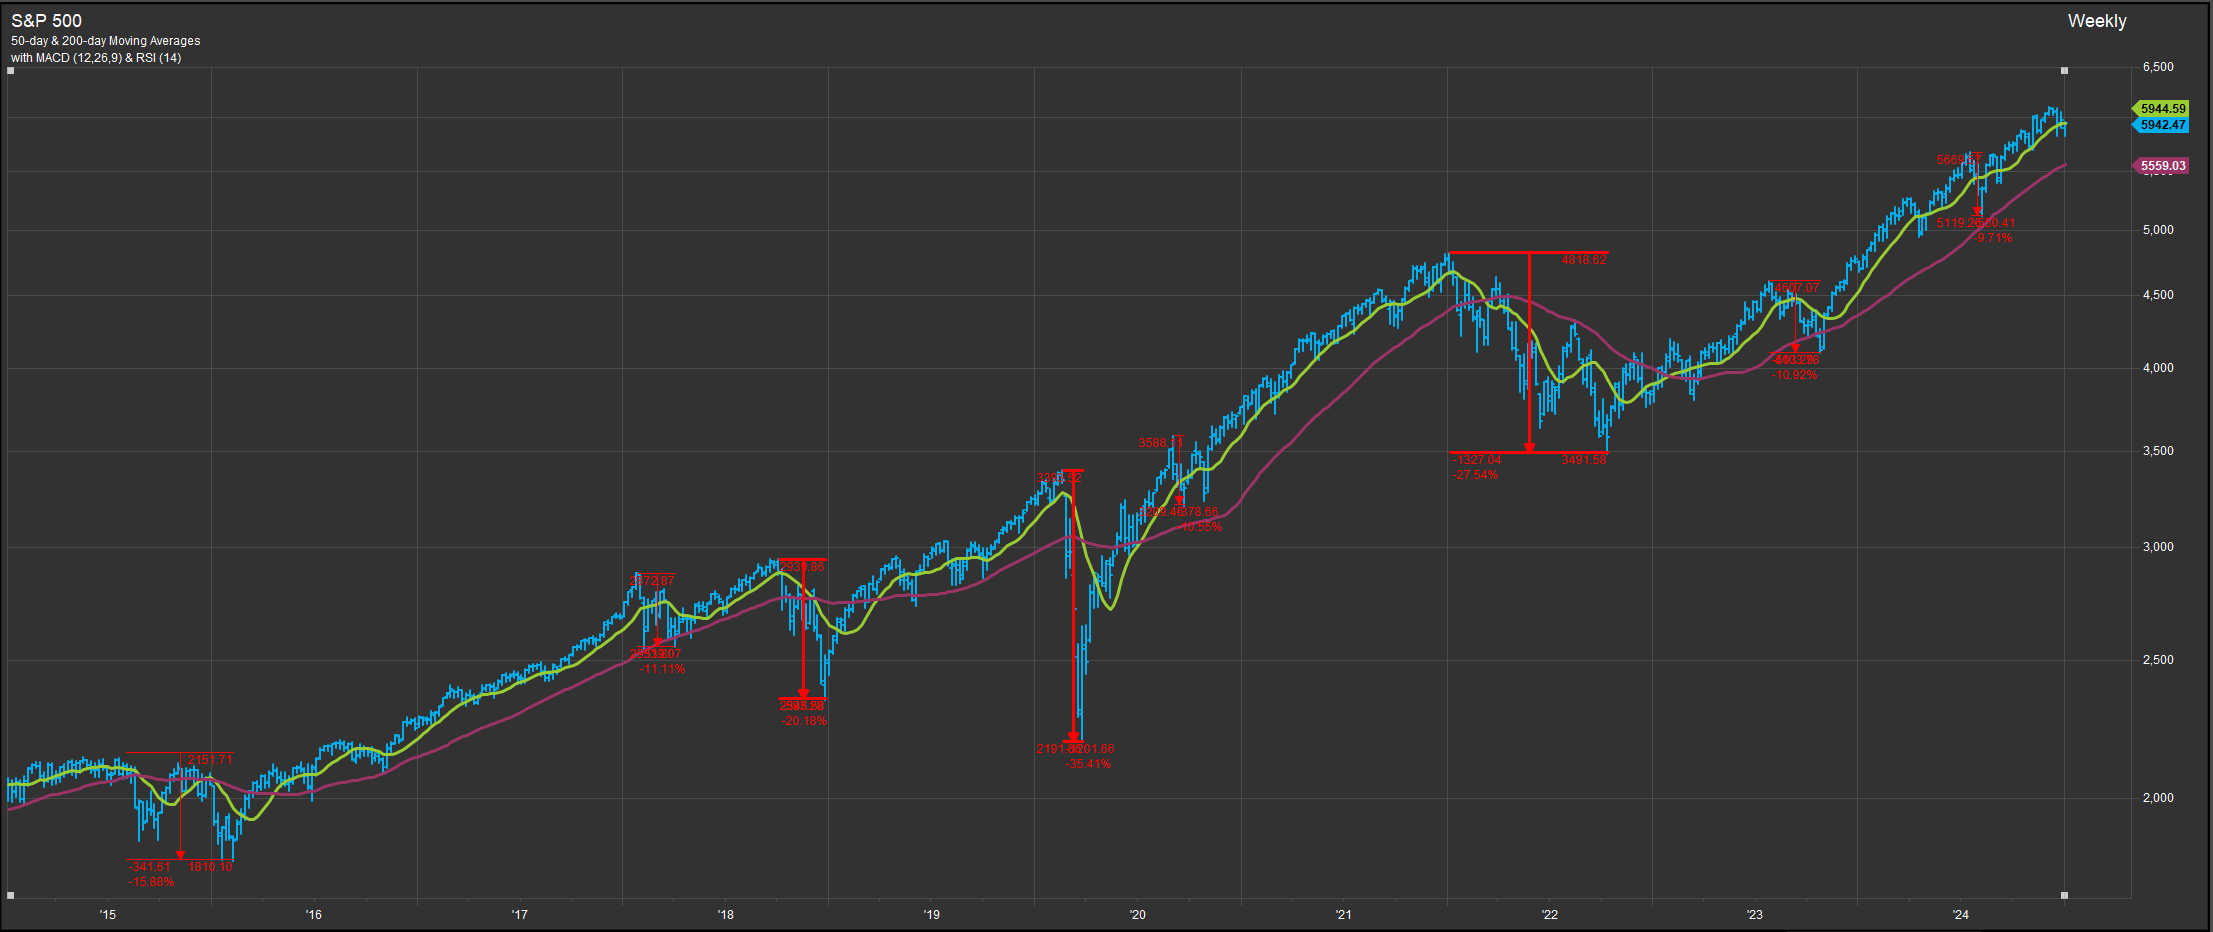
The chart below shows the S&P 500 over the past 20 years. The CURRENT secular bull market began in 2013 when the S&P 500 price made a new all-time high above its 2007 price high. The current secular bull trend for the S&P 500 has advanced prices +286% since its inception with the current cyclical advance at 26.3% above the 2021 high. We’ve seen cyclical advances of 35%, 38%, 15%, 42% and currently 26% in between corrections of >15% that have marked bearish interludes.

There are cyclical bear markets in every secular bull trend (chart below). Looking back over the past 10 years, we’ve seen 3 bear market drawdowns >20% and several other significant corrections. Apart from the inflationary scare of 2022, these pull-backs have lasted less than 6-months and have been accumulated aggressively after the low.
There have been 2 completed secular bull markets since the Great Depression. The inflationary bull market of the 1950’s and 60’s and the deflationary bull market of the 1980’s and 1990’s. The current secular trend is starting to resemble the 50’s and 60’s with the amplitude of its advance and the precursors to its ending instructive for today’s investors.
As seen in the chart below, the equity price uptrend got underway in earnest in 1950 when price broke above their 1946 high. An incredible factoid to keep in your back pocket is that the S&P 500 didn’t eclipse its 1929 price high until 1954. That might be a where a purist would start the count on the 50’s and 60’s secular bull. We measure from 1950 as that represents a contiguous uptrend through 1968. They key takeaways are the secular advance accumulated a 465% simple return over the time period, and the secular advance didn’t transition until interest rates had trended up to the 5.5-6% range. This is why we think the level and direction of rates is so important for assessing the current prospects for the US equity market. If rates stay contained, there is potential for US equities to move significantly higher.

We will spare you even more very long-term charts at present, but the bull market of the 80’s and 90’s saw the S&P 500 appreciate 1000% over 20-years. That puts the current 286% cumulative advance from 2013 in a more proper historical perspective. We think equities potentially have a much longer ramp. We will end this discussion highlighting the present setup for interest rates as proxied by the US 10yr Treasury Yield. The chart below shows the yield consolidating just below near-term resistance at the 4.67% level. If rates roll-over we’d expect markets to resume their path higher sooner. If rates move above that level, we will position for a deeper near-term correction.
Are Semiconductors Topping out?
Now that we’ve shared our version of technical “deep thoughts,” its time to transition to the thematic and tactical concerns facing us as we begin 2025. The first question we are looking to answer is, what is leadership? For much of this cycle, NVDA and Semiconductors have been a leading theme as exuberance around AI technology kicked off an arms race that has some similarities to the internet craze of the 1990’s. Common knowledge these days posits that businesses need to leverage AI capabilities to be successful or they will die an inefficient death. 2023 saw investors fully subscribed to that idea, as Mag7 and Semiconductor stocks were the clear winners on performance. 2024 has shown some signs of investor fatigue as manifested by Tech sector consolidation and the Philadelphia Semiconductor Index (SOX) consolidation throughout the 2nd half of the year. NVDA and AVGO remain strong, but the average Semiconductor stock has seen performance deteriorate.
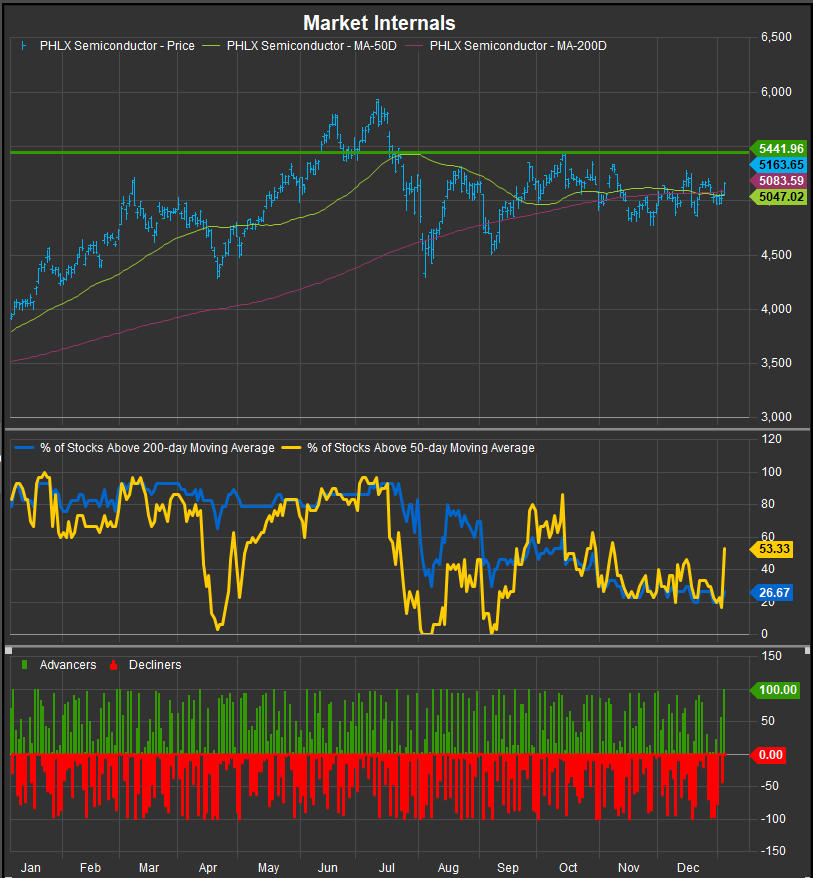
The chart of the SOX Index below shows Friday’s session was potentially significant as a bullish breadth thrust. The middle panel of the chart shows % of constituents above their 50-day and 200-day moving averages. Both series had ticked below the 20% threshold in late December, but the % of stocks above their 50-day average surged on Friday. We want to see price action confirm this move with an upside break-out above the 5441 level, which was the index’s October high. That would increase bullish conviction, and it would potentially signal a re-acceleration of the AI investment cycle.
Consumer Credit Flashing Warning Signs?
While we only have data through Q3 2024, we want to point out that credit delinquencies are on the rise for both consumers and commercial businesses. The chart below (panel 3) shows 90-day credit card delinquencies up 88% since the beginning of 2022. Consumer and C&I loan charge-offs are also rising steadily over that period (bottom panel). Rising over the past 5 years and rising interest rates have consumer balance sheets in a precarious position.

Homebuilders have Stalled Out
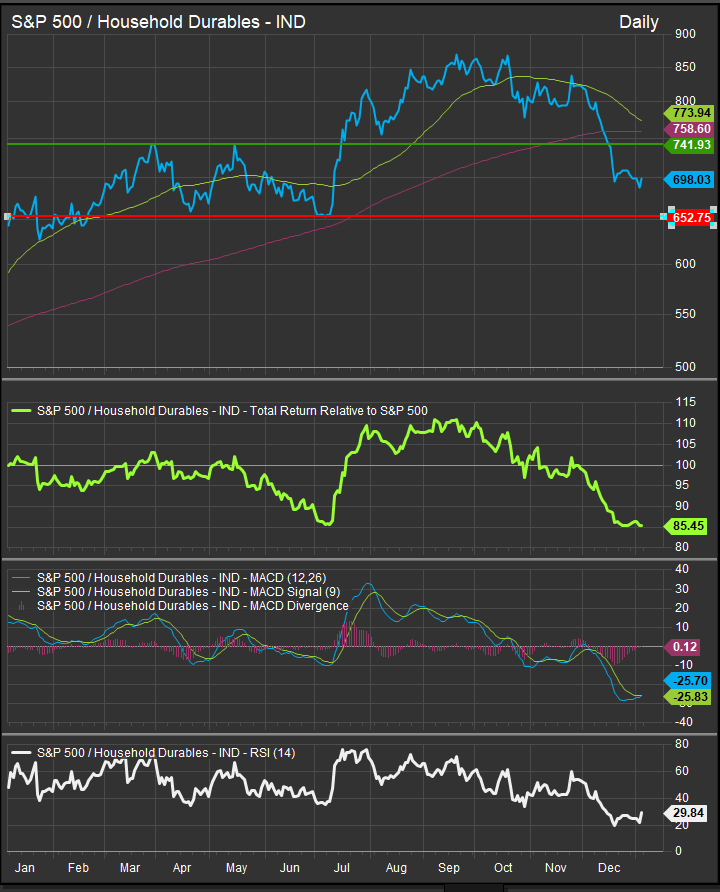
We are starting to see some cracks in demand, particularly in the housing market. Below is the 12-month chart of the S&P 500 Household Durables Industry. This contains the large cap. homebuilding stocks along with related co.’s like WHR and MHK. The Durables Industry was chugging along in a bullish stance until the Fed started its easing policy aggressively and Donald Trump won the presidential election. These two events were seen as “risk-on”, but they also triggered renewed inflationary pressures which are a threat to the current equity uptrend.
Conclusion
While our study of secular trends points to the potential for further upside in the bull market, interest rates will play a key roll in the first half of 2025. We think rising rates would likely tip equities into a more significant correction, but if rates stay contained below the 4.67% level we are likely to see more gains in the near-term as the Fed would have some wiggle room to keep supporting the domestic economy.
From a conceptual perspective, we are looking for evidence of new leadership themes as equities ended 2024 with very narrow breadth. For the time being we are positioned with the long-term uptrend and we are long Information Technology, Financials, Comm. Services and Consumer Discretionary sectors in our Elev8 Sector Portfolio with underweights to low vol. sectors and commodities adjacent sectors.
Data sourced from Factset Research Systems Inc.