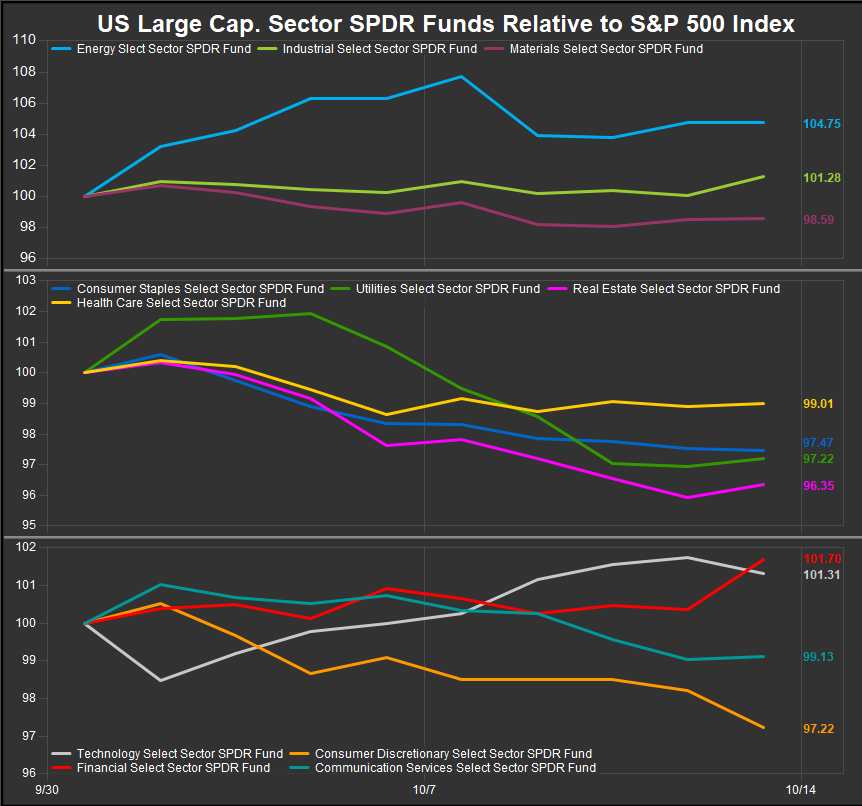
We have recently been spending time in this space monitoring the rally in commodities prices and talking about the potential for dovish interest rate policy to catalyze interest rates moving higher rather than lower as they had been since April. We are seeing that play out since the beginning of September. Energy, Financials, Industrials and Technology shares have led the tape since 9/1/2024.
As the chart below shows, the emergence of pro-cyclical leadership has come at the expense of the defensive side of the equity market as each sector in the middle panel has lagged since September 1st. What has differed from the classic bull market sector scenario has been the underperformance of Consumer Discretionary stocks in the near-term. There is still a tension between bull market expansion and inflationary pressures in the cycle, even as the Fed has declared victory over the latter and begins supporting the economy.
We pointed out in some of our fundamental deep dives over the summer that lower interest rates were key to offering the US Consumer relief. For a few months, the market was cooperating with the Fed’s policy interests as rates moved lower on softening data releases. However, investors are now moving out of bonds and positioning into more cyclical exposures in the near term. This new set of conditions has the potential to change the sector rotation dynamic whether the bull trend for equities continues or not.
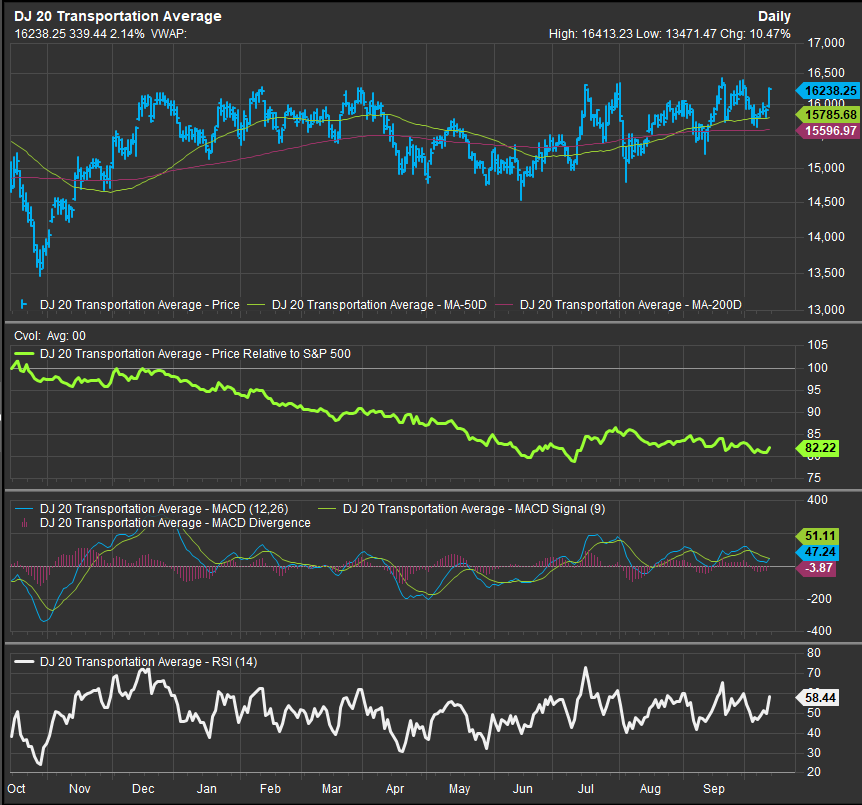
We’ve seen a recent rise in Energy sector shares, Crude Oil and Commodities prices broadly. This can be a bullish or a bearish development depending on the context. From a technical perspective, there are no clear bearish red flags at present, but we want to identify the indicators that can show us the next step in the development of the trend. With that in mind, we would recommend one of the oldest tools in the toolbox, the Dow Transportation Average.
The Dow Transportation Average (along with the Down Industrials) is a core building block of Dow Theor. Dow Theory is a trend following investment thesis conceived by Charles Dow, the progenitor of the Dow Jones Industrial Average and the founding editor of the Wall Street Journal. He believed Transports and Industrial stocks were an excellent proxy for the business cycle. Industrials build the inventory; transports distribute that inventory abroad to the customer. When both indices are trending higher the bull trend for equities is confirmed and the business cycle is in good shape as factories are busy with orders and transports are showing improving fundamentals shipping those orders to meet end consumer demand.
The chart below shows Transports improving in the near-term after disappointing for most of 2024. The key technical level is 16413. A move above would represent a significant technical break-out for the Index and it would also confirm a Dow Theory Buy Signal, as it would confirm the recent move to new all-time highs for the Dow Jones Industrial Average. If we see near-term breakouts on price, it is likely a clue to an early stage of a renewed bull cycle. If Transports fail at near-term resistance, we are more likely to need to position for more deflationary scenarios, either Growth led or recessionary.
–Patrick Torbert, CMT | Chief Strategist, ETFsector.com
Sector ETF’s/The Week in Review
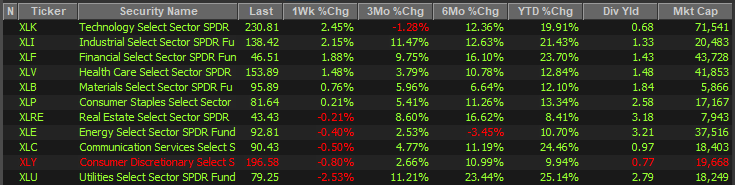
Using the Sector SPDR Funds as proxy, the XLK Technology ETF was the best performing last week followed by Industrials, Financials, Healthcare and Materials. As we alluded to in our opening, Discretionary and defensive sectors generally lagged. Energy also gave up some of the previous week’s gains. Overall we are still seeing some churn as many of the 6-month relative leaders are still defensive sectors, while the near-term has seen a shift towards Technology, Financials, and Commodities adjacent sectors Energy, Industrials and Materials.
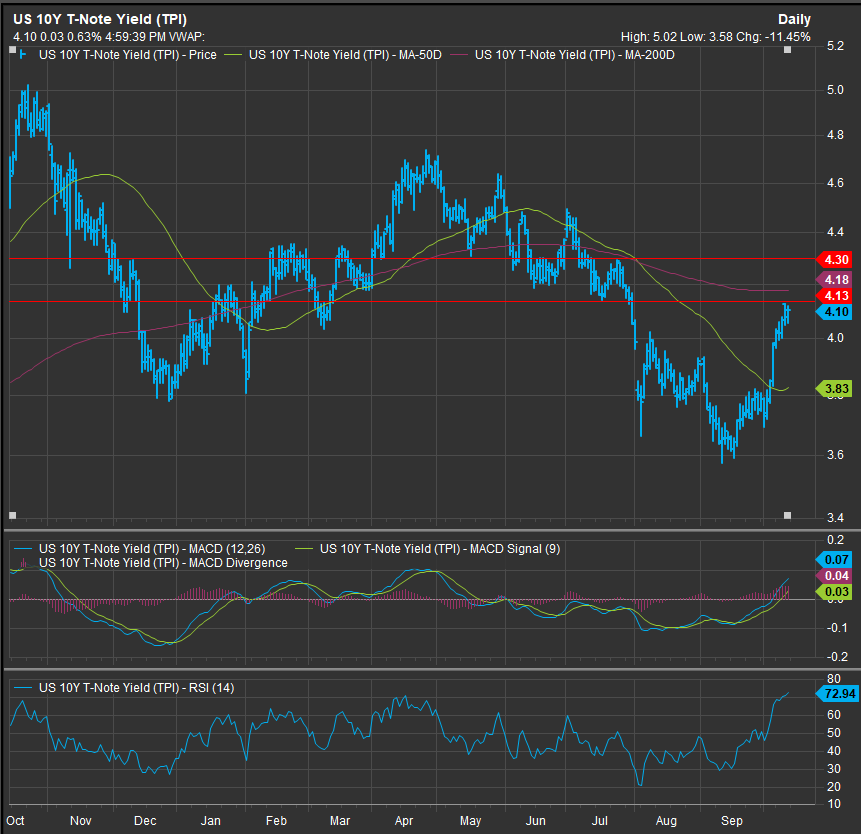
Our analysis currently still points to the continuation of the longer-term bull trend into year-end, and we are interpreting the present churn as investors re-evaluating the implications of a continued economic expansion. In this way, we think inflation is still a large consideration as we move forward. We will continue to monitor Commodities prices and the 10yr Yield as we move forward. There are clear resistance levels established for both and whether they hold or not will inform us on leadership.
The US 10yr Yield is at near-term resistance near 4.00%
The chart below shows the US 10yr yield YTD. With the yield backing up to intermediate-term resistance, we are now at the bottom of the longer-term horizontal congestion zone between 4.13% and 4.3%. The Yield is now overbought in the near-term in a weaker trend and we expect failure here, but a move higher would be signal.
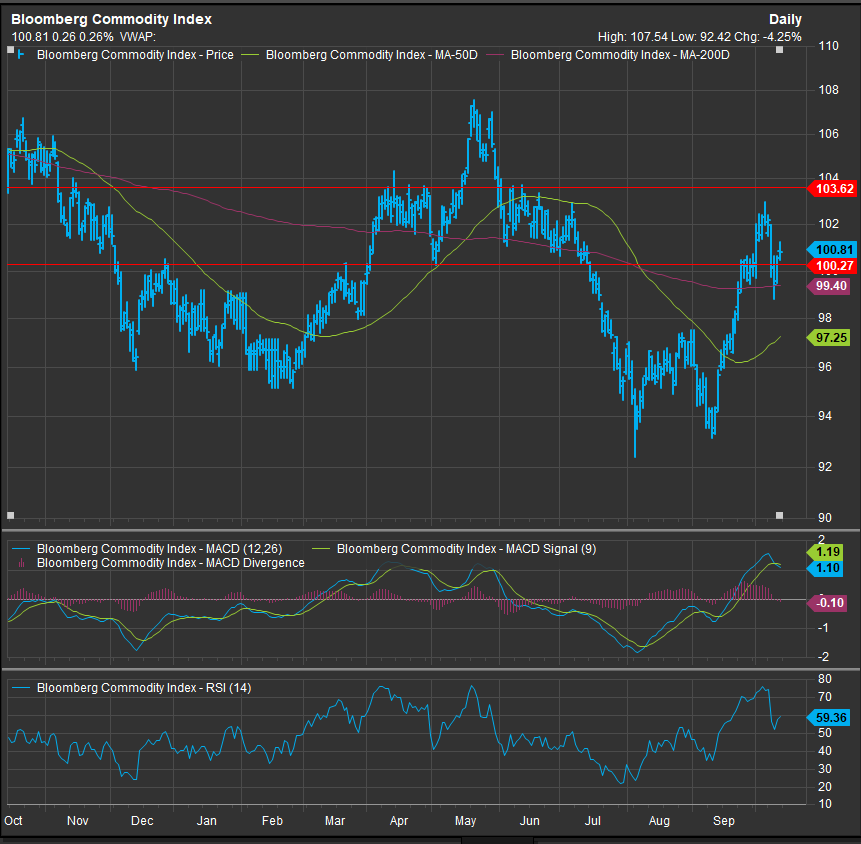
Commodities Prices Failing at Resistance?
The rally in Commodities prices failed below the 103 level. As we can see on the chart below, 103 and 108 are key levels to mark bullish trend change in Commodities prices. So far what we have on our hands is price retreating from overbought conditions in a downtrend. This keeps us short the Energy Sector heading into the week.
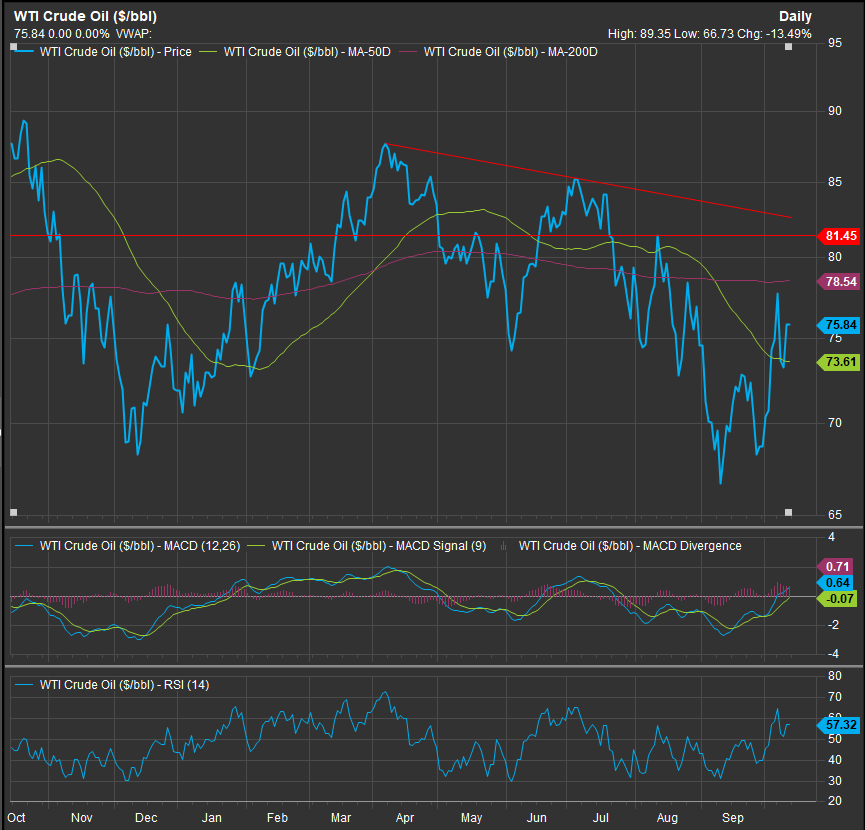
Crude Prices Still Short of Confirming Bullish Reversal
Crude prices consolidated last week shy of the 200-day moving average at $78.45. Congestion is heavy from there through the $81.45 level. This coming week will be pivotal for the Energy Sector as well as Commodities and Crude prices. We remain skeptical that this is where durable leadership resides, but we continue to monitor the situation closely and we will publish if our signals are triggered.
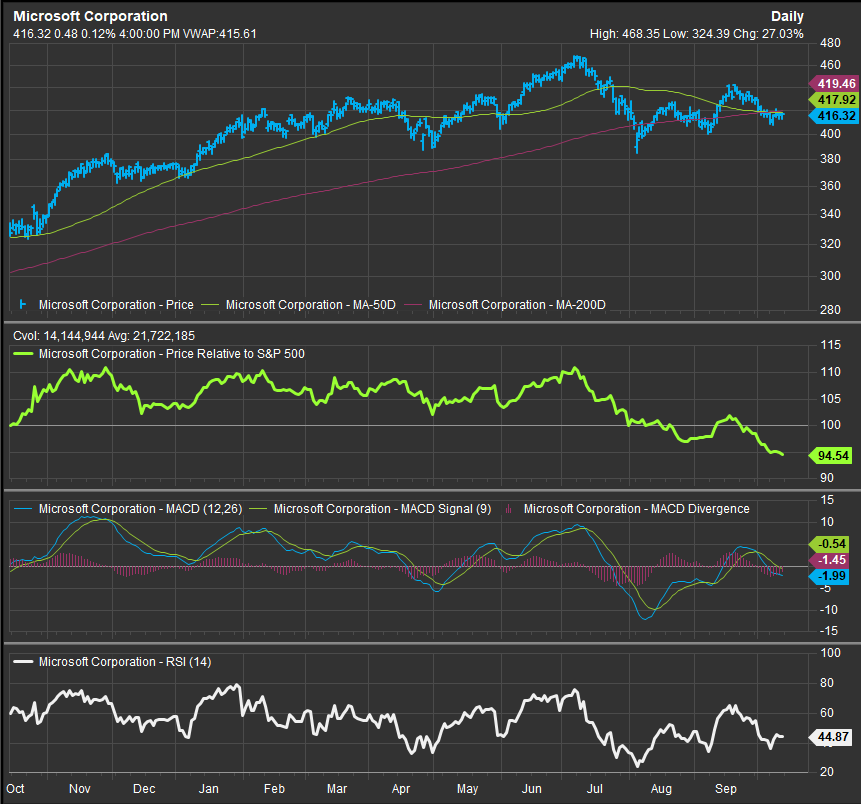
Mag7 Losing Steam?
The Mag7 Mega Cap. Growth stocks (TSLA, AMZN, META, GOOG/L, MSFT, NVDA, AAPL) have come under pressure since early in 2024. We are cracks in the cohort which is no longer performing as a monolithic block. MSFT, AAPL and GOOG/L have come under some pressure over the intermediate term. TSLA and AMZN are also in consolidation. META and NVDA still look very strong in our work. MSFT has a emerged as a weak link and the Software Industry in general is not behaving as leadership in the bull trend for the first time in a very long-time. A move below $400 on the chart below would take MSFT to a sell in our individual stock methodology. We have been optimistic about he bullish reversal since the low on August 5th, but the relative curve for MSFT (panel 2) has now made sequential lower lows which is a bearish sign.
Conclusion
The table is set for change, but the indicators have not been triggered yet. The direction of rates and commodities prices from here is likely to determine whether Value sectors like Financials and Commodities adjacent exposures lead or whether Technology, Mag7, and Growth positions get accumulated.
Source: FactSet Research Systems Inc.