March 14, 2025
When we last published on factors on February 21st, 2025, we looked at long-term performance trends for the most popular factors. You can find the piece here, but the TL:DR version of it is that the Growth factor has historically demonstrated long-term outperformance at the expense of Value over the period studied (2005-2024), while Quality, Dividend, Low Vol. and Momentum factors demonstrated mean-reversion characteristics over the longer-term. We further noted that “defensive” factors, Low Vol., Quality, Dividend, were out of favor in the present bull cycle.
Three short weeks later, that historical record remains, but a lot has changed in the present. Investors have sold Growth exposures in favor of just about everything else. US Growth is at the center of the crosshairs, but even ex-US there is some sign of rotation from previous leaders to previous laggards.
Large Cap. Growth vs. Value
The chart below shows Large and Mega Cap. Growth and Value as proxied by the Russell Style Indices. We’re showing performance trends over the past 2 years coinciding with the US Mega Cap. Growth-led bull trend.
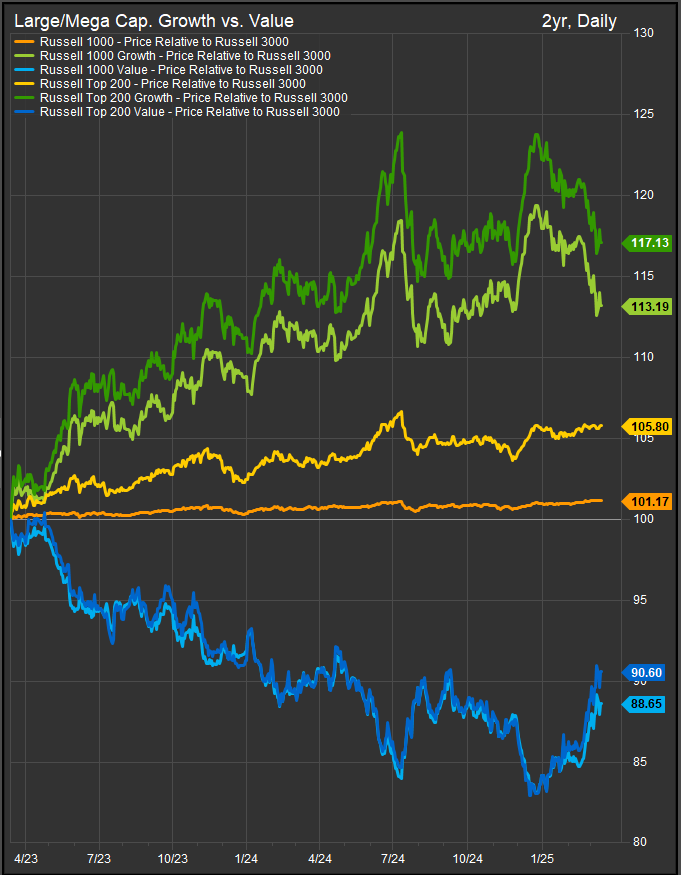
Value stocks’ relative performance curves are testing multi-month highs in the near-term. Over the longer-term we see how the uptrend in Growth outperformance has coincided with the bull trend over the past 2 years and how extended that trend got in July of 2024. As investors deal with the current shake-out, this chart reminds us that while Growth is out of favor in the near-term, it isn’t quite as obvious that it is done for good in this cycle. What we do know is the positive sentiment got pretty hyped above where actual reality has transpired, and we are in the midst of a corrective phase to get prices lined up with the situation on the ground.
We would expect a relief rally in Growth shares in the near-term given deeply oversold conditions, but we think a broader mix of stocks has a place in the portfolio with tariff and trade policy fomenting more uncertainty and more potential for change.
Small/Mid Growth vs. Value
Small & Midcap stocks are in a tough position (chart below). The Bull phase from 2023-2024 was driven by Mega Cap. Growth and hence Small Cap. stocks were sidelined from the leadership conversation, and now that a rotation away from Mega Cap. Growth is underway, it has enough “risk-off” flavor to it that Small Cap. stocks are again being passed over for more liquid exposures. The upshot is we haven’t seen the Value factor outperform in the Small/Mid space like we have in the Large Cap. stock universe.

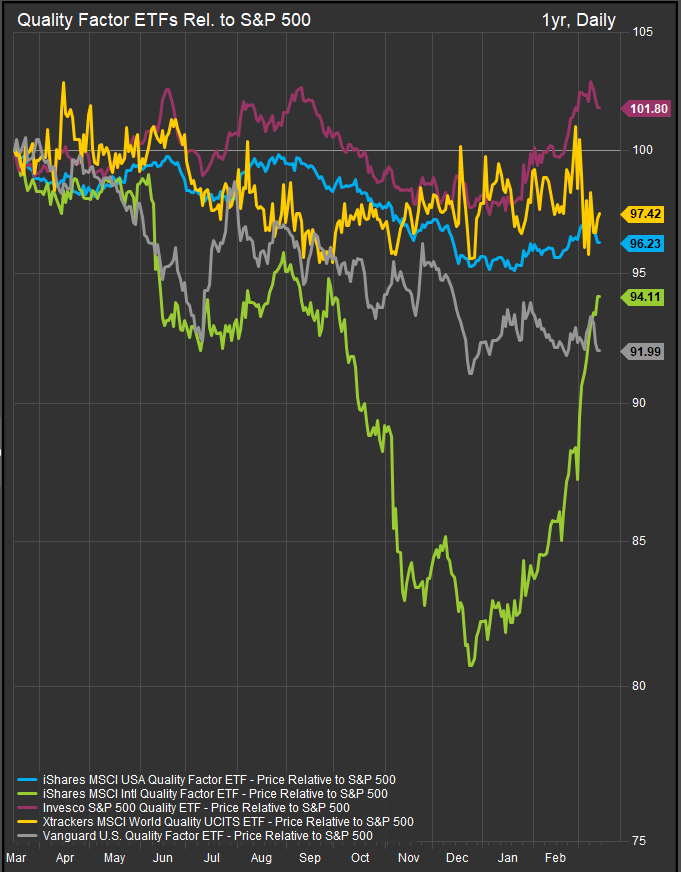
International Quality is Near-term Leadership
The Quality Factor is typically a mean-reverting performer that doesn’t get too far from par against broad equity benchmarks like the S&P 500 and the Russell 3000. However, we are seeing a sharp snapback in performance for ex-US stocks with high Quality characteristics. The chart below illustrates. Keep in mind many “Global” funds are US AND ex-US stocks combined while “International” factor funds are typically ex-US. The chart below shows International Quality and S&P 500 Quality as bullish pivots over the past 3-months.
Locally, Dividend Factor Has Been Strong
Keeping it in the US, Dividend Factor stocks have been the clear preference among equities while Government Credit and MBS exposures have been havens in the fixed income market. Interestingly, the worse a Dividend fund was performing before the recent correction, the better its shares have done over the past 3-weeks as the chart below illustrates.

Risk/Fear Indicators
We look at 4 ratios that have historically moved with changes in risk-seeking behavior along with the MOVE and VIX Indices which measure bond market and stock market volatility respectively. The last few days have seen some concsolidation and we think investors will try to “buy the dip” in the near-term. However, based on the intensity of selling, we expect an initial rally to fail, and we would get more interested in accumulating after a second down-leg for equities. Our expectation is underpinned by the speed and violence of the recent decline. One would expect that many (including ourselves) were surprised by the breadth and strength of the near-term capitulation. A rally gives those who are still nervous a chance for “trapped longs” to exit, and that’s typically where we get a second leg down. Typically, if downside momentum starts to weaken, that’s where we want to accumulate.

Conclusion
We think we are likely somewhere near the half-way point of the current US equity market correction. While there is a growing chance we are on the cusp of a longer bear market, we keep in mind that tariffs are a willful and voluntary exercise at this phase and can be walked back quickly if they aren’t benefitting the policy maker. The risk of course is if our trading partners move on to other alignments, we may not be able to “put the toothpaste back in the tube” so to speak. For now, we see shake out in US stocks as more risks have emerged with the Trump administration than were previously expected, but we also see an economy that is still growing despite our concerns. We are also seeing interest rates lower in 2025. The chart of the 10yr (below) has tested back to November 2024 lows. A move below the 4.13% would put the September 2024 lows in our sites and those lower interest rate levels may be perceived as the lifeline the Consumer, the Capital Goods spend, and the Venture Capital folks need to keep the good times rolling. That’s where we think relief would come at present.

Data sourced from FactSet Research Systems Inc.