March 21, 2025
Rotation continues to be the name of the game for global equity markets in 2025. Ex-US exposures have jumped to the fore on performance with German and Chinese shares showing improving technical characteristics, and ex-US Financials showing strength across regions. Domestically, YTD leadership has been migrating towards stocks with strong Value and Income characteristics and away from the tentpoles of the previous bull trend; Mag7 and AI.
In this week’s column, we take a look at longer-term factor performance trends. Near-term rotation has us on the cusp of some key pivot points for sector and factor trends. We review our trend and momentum indicators and a key bellwether stock to find clues on the longevity of current trends.
Large Cap. Growth vs. Value
The chart below shows Growth vs. Value going back to the start of the current bullish expansion. While the yellow lines indicate that Large/Mega Cap. is still in an outperformance trend we are seeing Growth/Value leadership dynamics at a longer-term inflection point. Value factor performance is on the cusp of longer-term bullish trend change if it can take out relative highs from July and then May 2024. Growth, in a reciprocal move, has broken down from its long-term uptrend channel and would confirm the reversal by breaking below horizontal support.

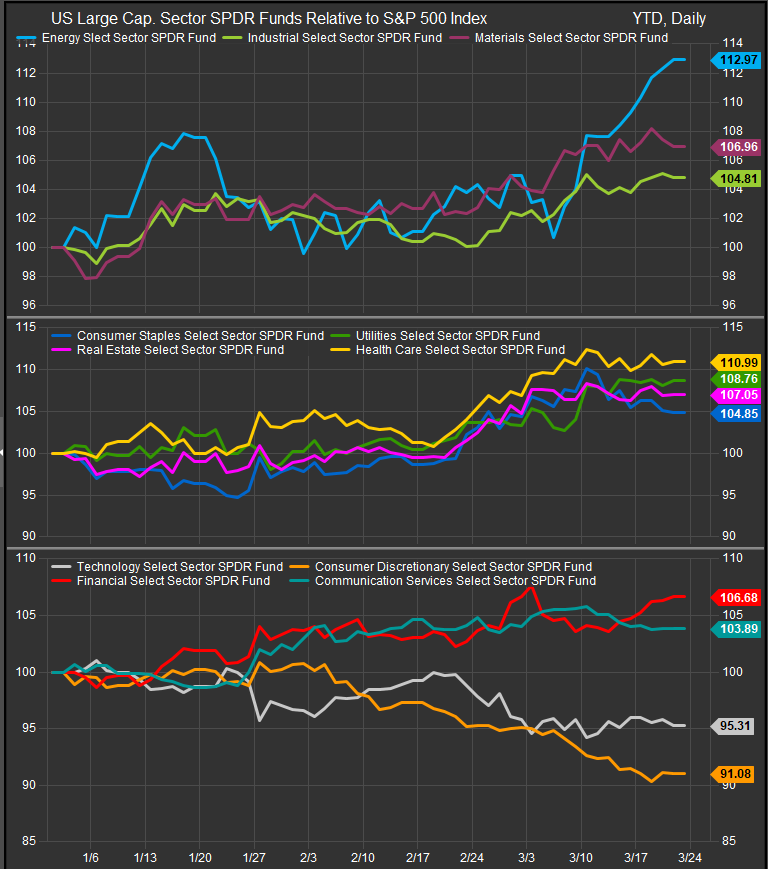
Sector performance (chart below) confirms the Value trend as commodities linked sectors (panel 1) and defensive sectors (panel 2) have led the S&P 500 over the past 3-months while Financials have outperformed vs. other Cyclical/Growth oriented sectors (panel 3). Moving forward, the direction of defensive sector performance should be a “tell” for the market. Durable bottoms are typically put in when offensive sectors start to firm up on performance even as top line equity prices drift lower. That’s the sign the market in general is interested in the near-term discount to prices and sees some level of intrinsic value in accumulating lagging shares.
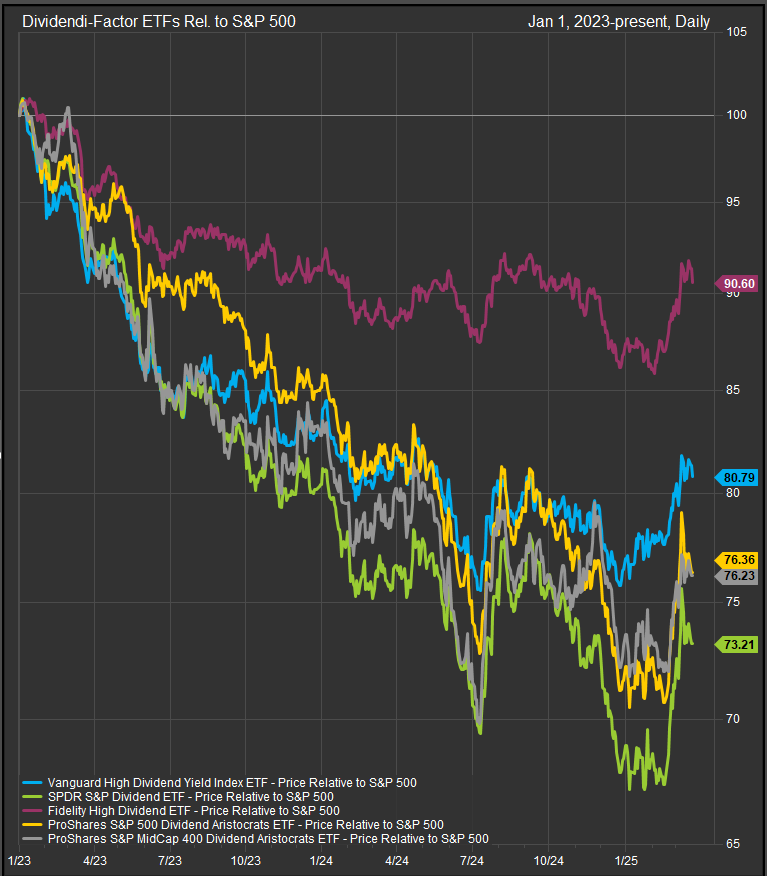
Dividend Factor Performance at Resistance
The chart below shows selected US dividend factor ETFs performance vs. the S&P 500 since the beginning of 2023. Similar to our defensive sectors, a move higher from here for these funds would be a bearish tell for equities and for the Growth trade. If investors have more risk appetite than they’ve shown YTD, now would be an expected time for that to manifest in bottom-fishing on discounted Growth names. The Growth bull doesn’t want to see these performance curves moving above levels they established in the summer of 2024.
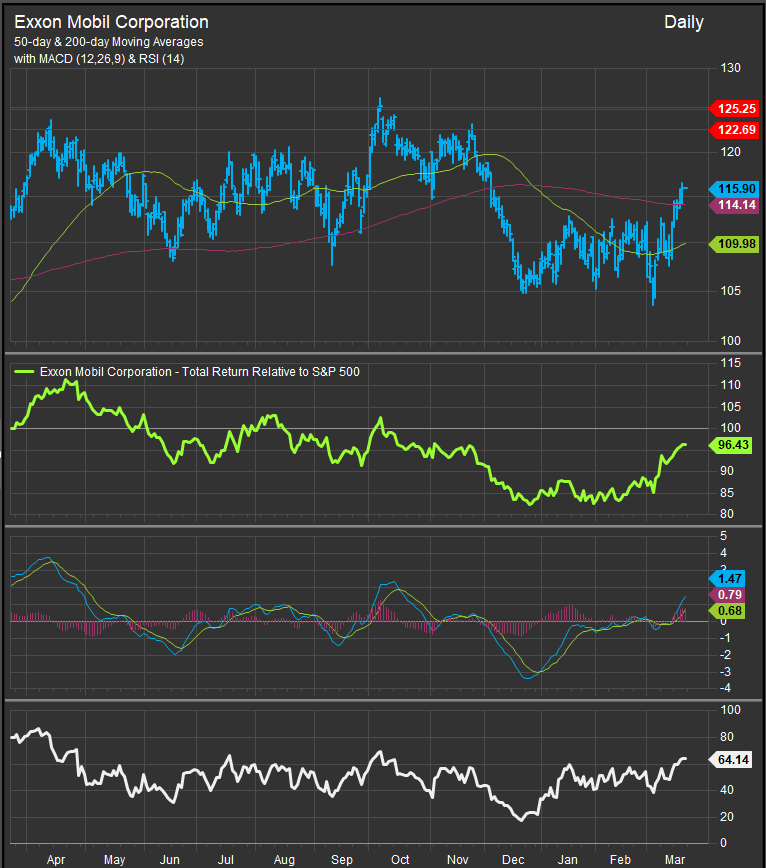
Energy Sector Bellwether Shows More Near-term Upside Potential
When looking for tactical signals in a rotating market, the behavior of widely known bellwether stocks can offer hints on where we are going. The chart below shows Exxon Mobile (XOM). Price has rallied in the near-term from $105 to $115, but we see overhead resistance at $122-125. If we had to make a prediction at present, we would expect the stock can continue to rally into that level which implies another leg higher for Energy and commodities related exposures given their generally high correlation to each other.
Looking for Positive Divergences
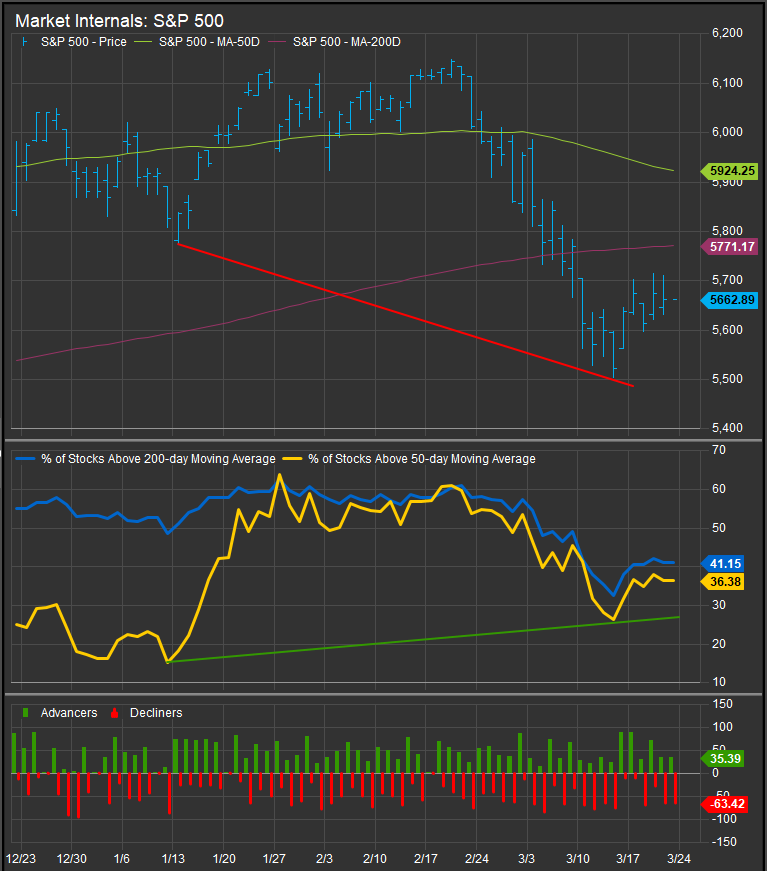
The other technical tool that does a good job of presaging trend change is looking for divergence from the top line equity trend through market internal trend studies and momentum studies. At present, we are seeing a potential positive divergence developing in the former, but nothing positive evident in the latter.
The chart below shows S&P 500 internals in the near-term. More stocks were above their 50 and 200-day averages in March despite lower prices for the S&P 500 index than there were in February at higher prices. If these two series continue moving higher there starts to be a case that investors have priced in the bad news and are looking beyond. We would exercise some caution here because of the concentrated nature of the previous Growth-led bull trend. The Mag7 cohort is so large, it may be hard for the index to move sustainably higher if those names continue to face headwinds.
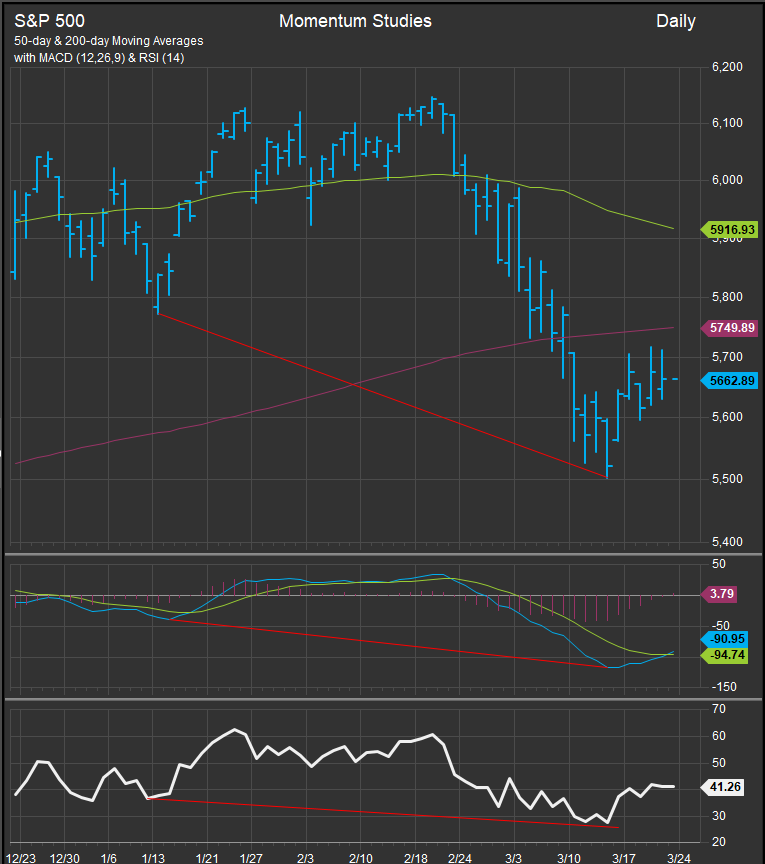
That’s why we also want to keep the momentum studies in mind. They are not showing any positive divergences yet, and this is a key ingredient to establishing the conviction needed to position for upside. The chart below shows the S&P 500 with MACD and RSI studies moving to new lows in coincident fashion. This is still a bearish posture.
Conclusion
Rotation away from Growth continues. We think there’s more upside for commodities related stocks in the near-term which supports continued outperformance in the Value trade. We will be looking closely at performance of defensive sectors and factors vs. those that offer exposure to Growth to try and sus out the next potential pivot for the US equity market. We don’t have high conviction signals to move off a defensive posture in our positioning yet.
Data sourced from FactSet Research Systems Inc.