Equities faded after a strong open with the major US indices finishing the day near worst levels. The S&P 500 finished off 0.16% while the Dow gave back 0.14% and the Nasdaq Composite finished 0.06% lower. Oil prices hit a six-week intra-day low to spur the XLE to a decline of 1.59%, the worst result among the Sector SPDR’s. XLB (Materials) and XLF (Financials) were the only two sectors finishing positive on the day.
US Treasury yields were off slightly with the 2yr note yield dipping to 4.49% while the 10yr held 4.25% amid softer commodities prices.
The Russell 2000 was a bright spot for the day, adding 1.02% and continuing to make-up ground vs. the S&P 500 in the near term. With a lot of longer-term leadership trends mean-reverting in the near term, it wouldn’t be surprising to see the R2K continue higher.
Mortgage Applications and New Home Sales top the list of economic data releases for Wednesday, and the earnings release schedule is one of the busiest of the year with 41 S&P 500 Constituents reporting.
Eco Data Releases | Wednesday July 24th, 2024
| Date Time | Event | Survey | Actual | Prior | Revised | |
| 07/24/2024 07:00 | MBA Mortgage Applications | 19-Jul | — | — | 3.90% | — |
| 07/24/2024 08:30 | Advance Goods Trade Balance | Jun | -$98.7b | — | -$100.6b | -$99.4b |
| 07/24/2024 08:30 | Wholesale Inventories MoM | Jun P | 0.50% | — | 0.60% | — |
| 07/24/2024 08:30 | Retail Inventories MoM | Jun | 0.50% | — | 0.70% | — |
| 07/24/2024 09:45 | S&P Global US Manufacturing PMI | Jul P | 51.6 | — | 51.6 | — |
| 07/24/2024 09:45 | S&P Global US Services PMI | Jul P | 54.9 | — | 55.3 | — |
| 07/24/2024 09:45 | S&P Global US Composite PMI | Jul P | 54.2 | — | 54.8 | — |
| 07/24/2024 10:00 | New Home Sales | Jun | 640k | — | 619k | — |
| 07/24/2024 10:00 | New Home Sales MoM | Jun | 3.40% | — | -11.30% | — |
S&P 500 Constituent Earnings Announcements by GICS Sector | Wednesday July 24th, 2024
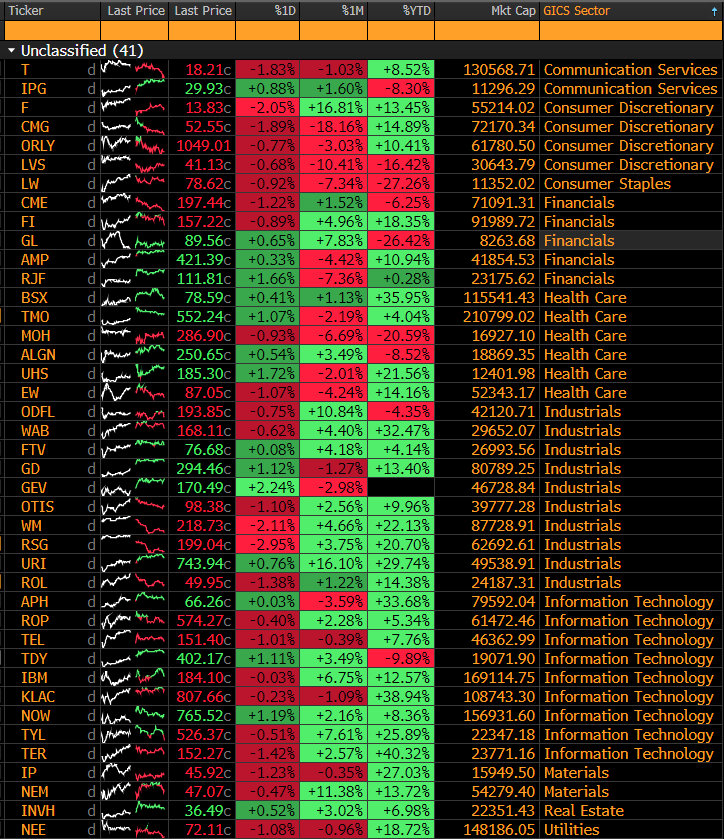
Big release day. Equity investors will have a lot to digest. Yesterday GE posted strong results. The stock is near-term overbought, but the longer-term trend hints at more potential upside. See the charts below.
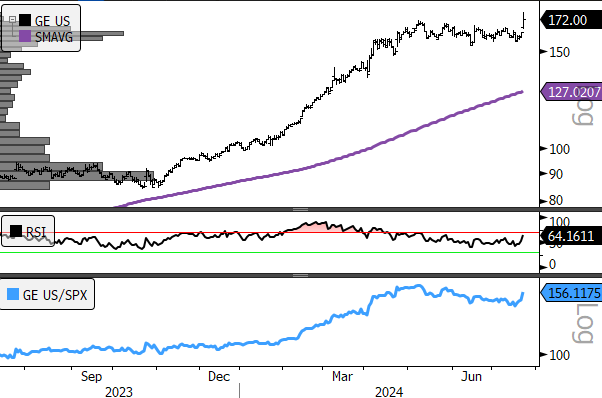
- GE 1yr, daily (200-day m.a.| Relative to S&P 500)
- GE pops to an overbought condition, but…
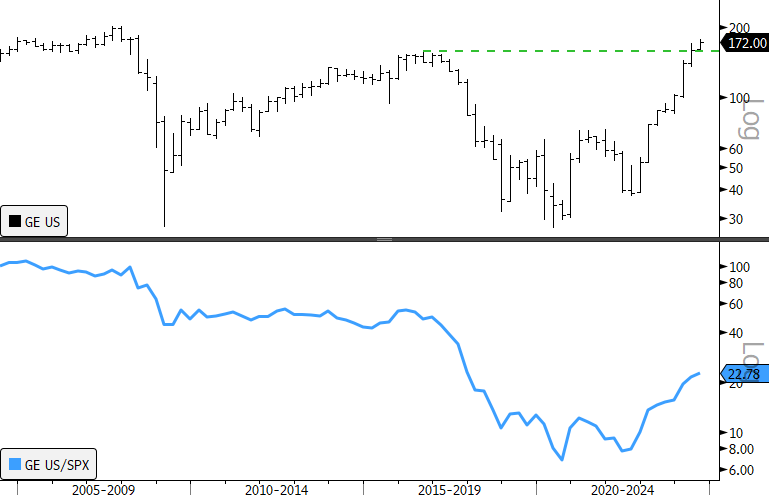
- GE 20-year, quarterly
- Panel 2: Relative to S&P 500 (normalized to 100)
- GE has been ripping in 2024, but the long-term relative curve has only retraced around one-fifth of its long-term decline. There is likely more upside here.
Sources: Bloomberg