ETF Insights| November 1, 2024 | Energy Sector
Price Action & Performance
Using the XLE as a proxy, the Energy Sector started November on a rally that eventually failed below July 2024 highs. The sector continues to consolidate price and lag relative to the S&P 500. Energy stocks are the most highly correlated to Crude Oil prices and the latter have traded down to long-term support levels with the WTI contract finishing November $65-70 support zone.
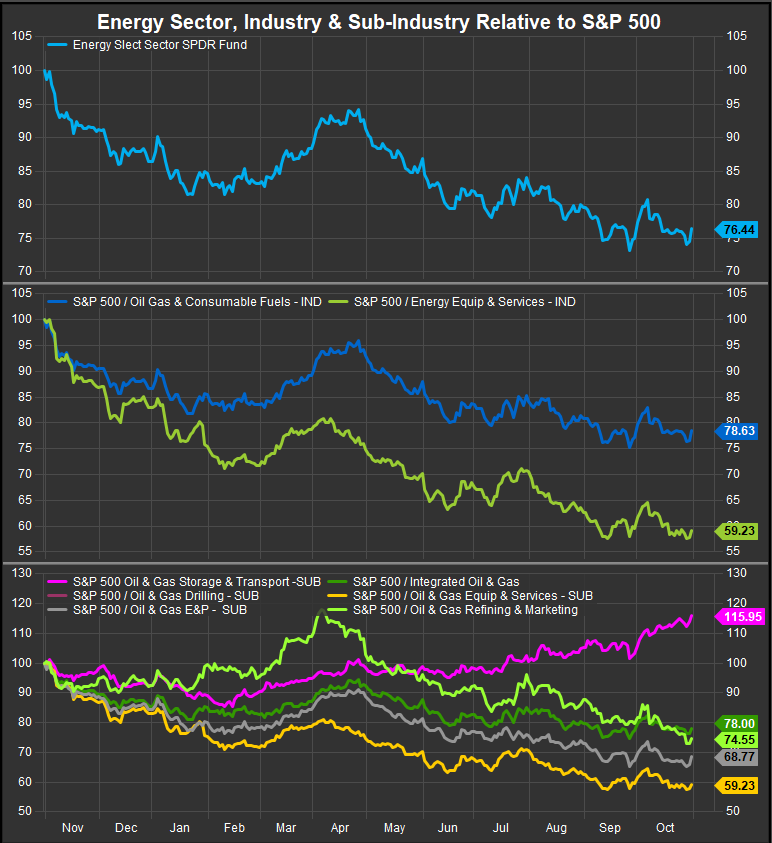
The bright spot within the sector at the industry level is the Oil Storage and Transport Sub-Industry. Integrated names, Oil Services, E&P and Refiners continue to trend lower and are among the weakest areas of the equity market YTD.
At the stock level, the best charts from our view continue to be income-generating areas of the sector. Oil Storage and Transport Co.’s and MLP’s are where the strongest performance in the sector is. TRGP, OKE, WMB and KMI are among the best performing Energy Sector charts and are our highest rated stocks currently.
Economic and Policy Drivers
The Energy Sector price bounced in July on optimism that Donald Trump will regain the presidency. A Republican administration is perceived as bullish for legacy energy producers which comprise the lion’s share of the GICS Energy Sector. Concerns of a global supply glut remain amidst societal trends away from fossil fuels (vehicle electrification, alt. energy infrastructure, ex-US ESG initiatives) and ever more readily available alternative energy streams coming online.
The switch to dovish Fed. policy has not been a boon to the Energy sector at this point. We are not experts on the global supply/demand dynamics for fossil fuels, but we are keen observers of stocks and price trends. We mention this because we are seeing weakness across a broad array of alternative energy sources like solar (FSLR, ENPH), and wind (Vestas Wind Systems). The big winners in the intermediate term appear to be nuclear stocks like LEU and Utilities like VST and CEG.
Continuing fighting in the Middle East has not provided any boon to prices despite a year of combat involving many major players in the region. Recent reports suggest Israel is finally taking some steps to de-escalate the situation with Iran. This is of course and extremely volatile circumstance, but the charts at this point are unambiguous.
We do think that if Candidate Trump gains in the polls, the XLE will likely rise as well, but with the race a dead heat only a week away from the event and our indicators still acting poorly, we remain on the sidelines.
In Conclusion
Despite some rotation away from Mega Cap. Growth, we haven’t seen any sustained benefits to the Energy Sector in the short or intermediate term. Our Elev8 Sector Portfolio starts November with a zero-weight allocation to Energy leaving us 3.24% BELOW the benchmark S&P 500.
Chart | XLE Technicals
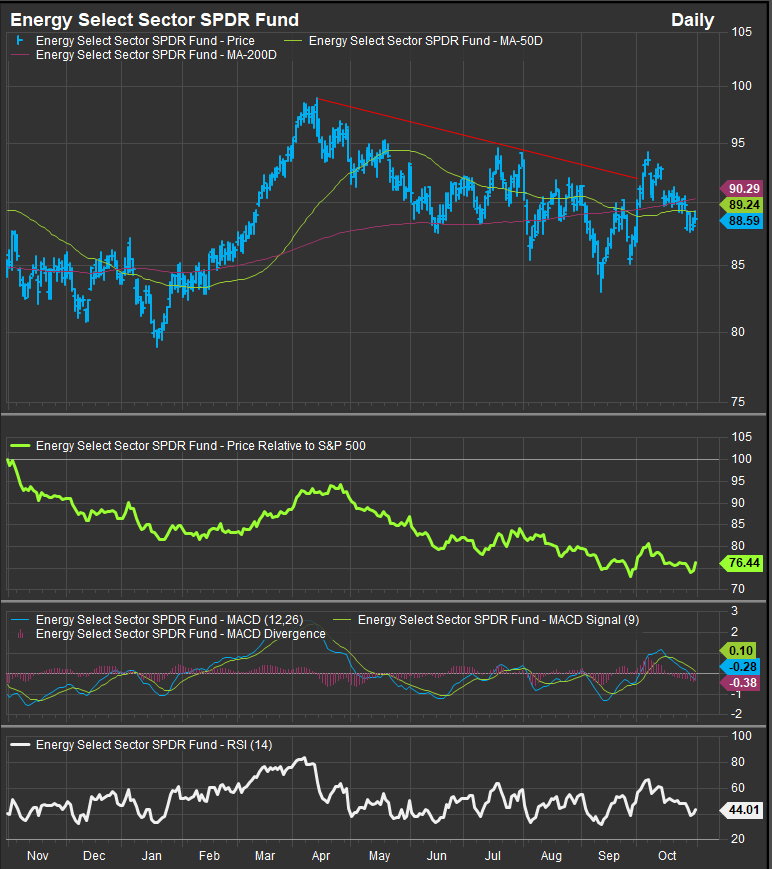
- XLE 12-month, daily price (200-day m.a. | Relative to S&P 500)
- Some signs of bottoming, but not enough to go long the weakest performing sector YTD
XLE Relative to S&P 500 with Industry and Sub-Industry Relative Strength, T3M
Data sourced from FactSet Research Systems Inc.