It’s been a rocky start to 2025. January has seen a few tricks from the bear with a week to go. The month started with concerns over inflationary pressures and a move higher in long-term US rates. This past week US equity markets began discounting a challenge to US AI dominance with the emergence of DeepSeek, a Chinese AI concern that has demonstrated comparable results to big US players with a fraction of the investment. This latest development led to a sharp decline for US Technology stocks, particularly high-end Semiconductor co.’s like NVDA. We look through our charts to identify important support levels where investors are likely to perceive accumulation opportunities.
S&P 500
Large cap. US equities have been range-bound since the November election when Donald Trump’s victory propelled equities to gap higher and begin discounting bullish deregulatory scenarios for the US. As seen on the chart below, the bottom end of that election day price gap has functioned as key support for the S&P 500 during its current consolidation. We view 5780-5785 as a key level for the index. If price moves below, we would expect a deeper correction with potential to test the August 2024 lows around 5200, >10% below today’s prices.

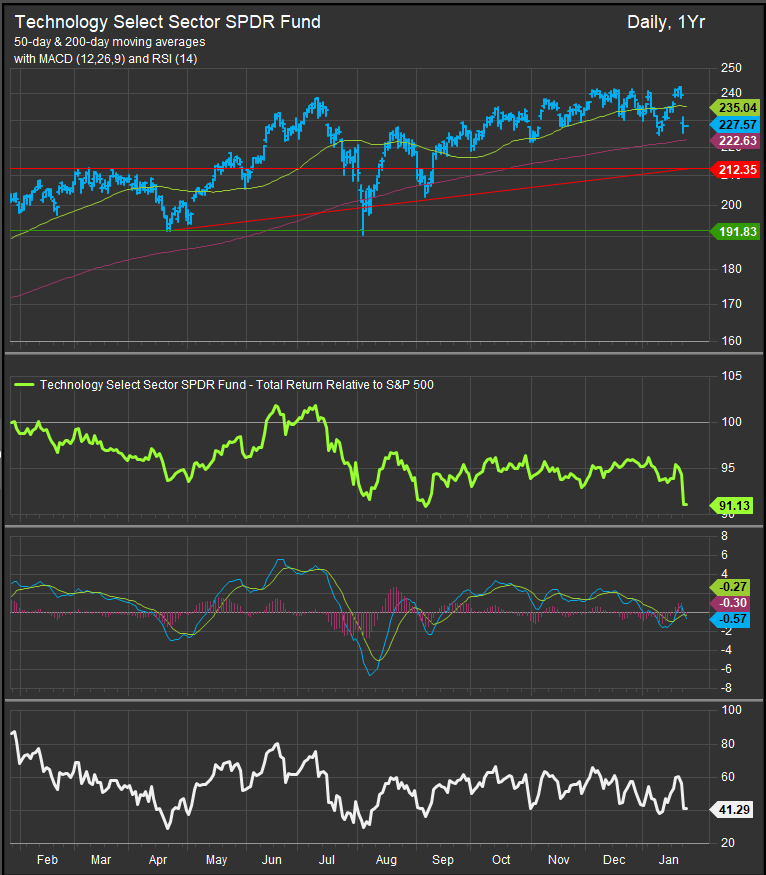
US Technology Sector
The Tech Sector has borne the brunt of the recent decline with shares down >3% on Monday. Per the XLK chart below, we are monitoring the 212 level as a potential support for the move. That level coincides with March 2024 highs, and we think price action above that level is what is in question, given momentum has diverged significantly since peaking after the next upwards move into July. If 212 breaks, we would expect 191 to be seen as a likely accumulation opportunity for Technology shares.
Semiconductors
Semiconductors have been in an ambiguous consolidation since September. Recent weakness comes just as the index had made a new multi-month high, and yesterday’s decline has us back at the bottom of the range. Per the chart below, a violation of near-term support at 4767 would setup a likely retest to 2024 lows near the 4288 level which would represent a > 10% draw down from today’s prices.

Conclusion
Keep an eye on near-term support levels for the S&P 500, the S&P 500 Technology Sector and the SOX Index. Downside violations would be a “tell” that a more significant correction is in the offing.
For the bull, we’d like to see yesterday’s intra-day lows hold up as the buyer looks for deals. One ray of light for the pro-Growth trade is that interest rates are retreating with yesterday’s bearishness. The direction of rates has been pushed out of the limelight, but it remains a key input for us as well. That in itself won’t stop near-term selling, but sustained lower rates would set up quality accumulation scenarios down the road.
Data sourced from FactSet Research Systems Inc.